Tips for Prepping Reports for Your Digital Agency Clients

Aside from the list of tasks they’re paying you for, your clients should understand how their marketing campaigns are performing. A monthly report can help shed some light on this.
Transparency is something that clients value. Even if it’s to hear “Your traffic went down last month,” they appreciate that more than utter silence from a digital agency they’re paying every month to work on their behalf.
At the same time, you never want your communications with clients to revolve around generic bad news or good news.
“You gained 5 followers on Facebook!”
“No one downloaded your lead magnet last week.”
“Engagement is up 13%.”
There’s very little value in communicating context-less stats to your clients in this manner.
This is why it’s a good idea to prepare monthly and annual digital marketing reports for your retainer clients. Not only does this give you a chance to share an overview of how their brand is performing online, you can lend your professional insights into what’s going on, why and what you plan to do next.
In this post, we’ll look at why it’s worth it to create these monthly reports as well as tips on how to prepare them.
Are Custom Marketing Reports Necessary?
Your marketing and advertising platforms have dashboards that contain “insights” about your campaigns. The only problem is that what they call insights are usually nothing more than numbers.
For example, here is a Traffic Acquisition table from Google Analytics:
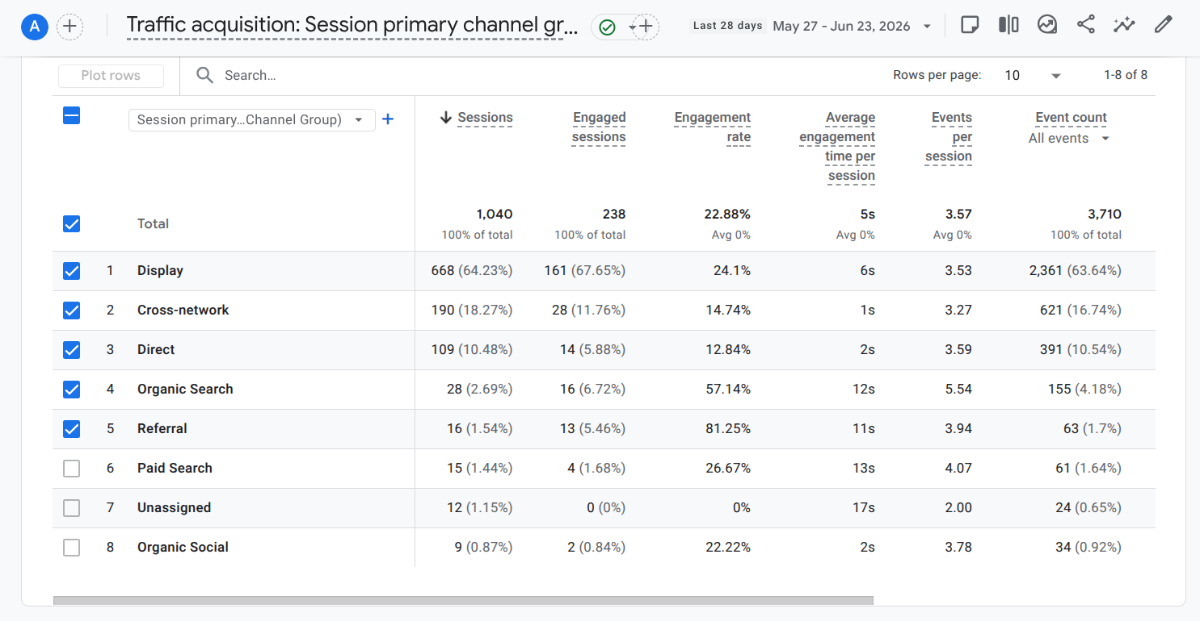
There are ways to set up automated reporting in platforms like Google Analytics. And you can aggregate different data sets so that you don’t get individual reports for Acquisition, Traffic, Conversions, etc. But for many clients, these reports just look like a bunch of numbers. And, in many cases, these tables and charts include terminology they don’t understand.
For instance, what would “Cross-network” mean to them? Or “Engagement rate”? What’s more, even if they did know about the general traffic acquisition types, do they really understand what the data is telling them within the context of the work you’re doing?
This is why a custom monthly report is necessary. You can and should include these data sets from your marketing platforms within the report. However, you also need to describe what’s being depicted and analyze the results in order for it to have meaning for your clients.
Why You Should Be Preparing Marketing Reports Every Month
The biggest reason is transparency. Imagine shelling out a few hundred or thousands of dollars to a company every month. They promise they’re doing the work you pay them for, but there doesn’t seem to be much to show for it. And with something like marketing, it can be a slow burn.
How long do you think you’d be willing to keep paying a vendor with no proof or payoff?
Your monthly marketing report is your chance to be transparent about what’s going on. Even if you’re not giving them a play-by-play of every website update you make or post you put on Facebook, you’re showing them the end results—and that’s often the only thing that clients care about anyway. It’s why they’re outsourcing this to you in the first place, after all.
There are other benefits behind creating custom reports from month to month. For example:
Monthly reporting requires you to make time to carefully review the results of your work every month. This helps verify you’re delivering results and achieving the goals you set out to accomplish at the start.
If you find that something isn’t working, these reports enable your team to make informed decisions regarding the strategy. You might decide to stay the course a bit longer, adjust or even start over. The point is, you’ll know if something isn’t working right away, which will allow you to take timely and data-driven action to change it.
As for your clients, monthly reports can change how they view what you do. By creating reports that focus on the outcomes, your clients will see marketing and advertising as a valuable investment; not just money that flows out of their wallets each month.
The more satisfied they feel with your investment, the less likely they are to question your decisions or to feel untrusting of the whole process. Your monthly reports establish your digital agency as one that is transparent, hard-working and professional.
So, if you’re looking to hold onto your monthly retainer clients for longer, these reports can help instill a good amount of trust in them.
Tips for Preparing Digital Marketing Reports for Clients
Just because you create a report doesn’t mean your client is necessarily going to read it. To make it worth their time, here are some tips on how to prepare it:
1. Bring All the Data Together
Typically, when preparing marketing reports, there are going to be two components. One is the raw data set from the time period. The other is going to be the summary and analysis that explains what the data means.
This tip has to do with the raw data.
Unless you’re using an omnichannel marketing platform to aggregate your marketing data, you’re going to have to bring it all together on your own. My favorite way to do this is with a spreadsheet.
Here’s an example of a monthly data pull I do for one of my clients in Google Sheets:
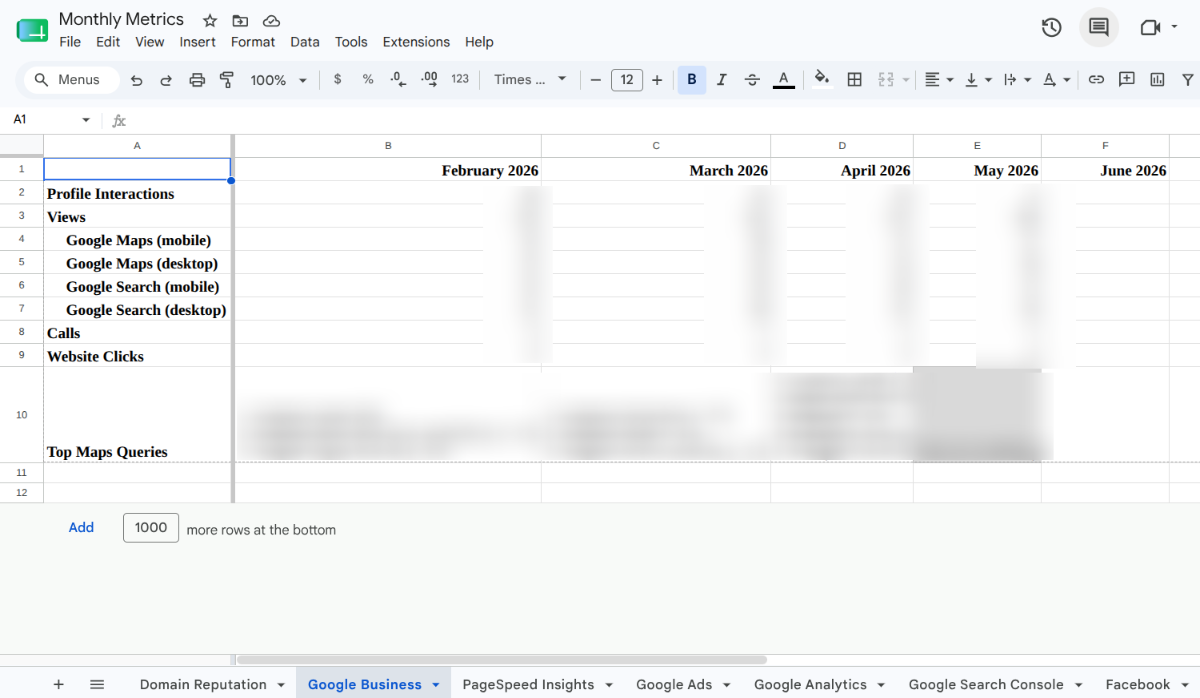
Look along the bottom and you’ll see all the tabs I use to centralize my client’s marketing and advertising data:
- Domain Reputation (from Moz)
- Google Business (local search metrics)
- PageSpeed Insights (performance metrics)
- Google Ads (advertising metrics)
- Google Analytics (website metrics)
- Google Search Console (SEO metrics)
- Facebook (social media metrics)
I like this approach for a number of reasons.
To start, it allows me to choose which data points my clients see. I’m not hiding anything from them. I’m just keeping their focus on the most pertinent data.
For example, for Google Business, there’s a data point for Bookings. Since my client doesn’t take bookings through Google, it doesn’t make sense to include that information in the report. I strip out other irrelevant data from the other tabs.
By putting data into spreadsheet, I’m also about to highlight fields, add comments and emphasize certain cells. With a PDF printout from the source, you really can’t make the data your own. You just have to run with what you get and then explain what the client should focus on in the summary. And I’d rather keep the presentation of data as clean and on-point as possible.
2. Include Benchmarks Data and Goals
Another reason I prefer using spreadsheets to share marketing data is because it allows me to show how the metrics have changed over time.
Typically, when you get a report from a marketing platform, it either provides no information about what happened in the past or it’ll show you a percentage change from month to month.
But in marketing we don’t look at data in isolation like that. The changes that happen over time tell us a story about what’s happening and can also shed light on why.
So when putting together your data sets each month, you should include not only recent history, but a benchmark. Now, what this benchmark ends up being will depend on what the data is and how long you’ve been tracking it.
For example, I’ve only just begun working on this campaign this year. So, for me, the benchmark reference is February 2026. This was the month before I began working for the client. By keeping this data in each spreadsheet, I’m able to see what their typical performance was before we began optimizing our efforts.
It’s not enough to just look at the starting point though. I include all the months in between so I can see changes from month-to-month as well as over time.
Now, let’s say you’ve been working with a client for over a year, you might want your benchmark to be:
The average monthly metrics from the previous calendar year.
This will allow you to compare your current performance against what was the typical result last year. This is a good way to do it if you have enough data and things remained relatively steady throughout the year.
Alternatively, it might make more sense for your benchmark to be:
The same month’s metrics from the previous year.
So, if you’re working on pulling data for August 2026, you’d use August 2025 as your benchmark. This is mostly beneficial for brands that have seasonal peaks and slumps. That way, if August tends to be slower, you’re not gauging performance against the entire year’s average (which may be much higher than your typical slow period).
I also think it’s valuable to include goals within your data sets when possible. For example, here are the goals I’ve set for PageSpeed Insights:
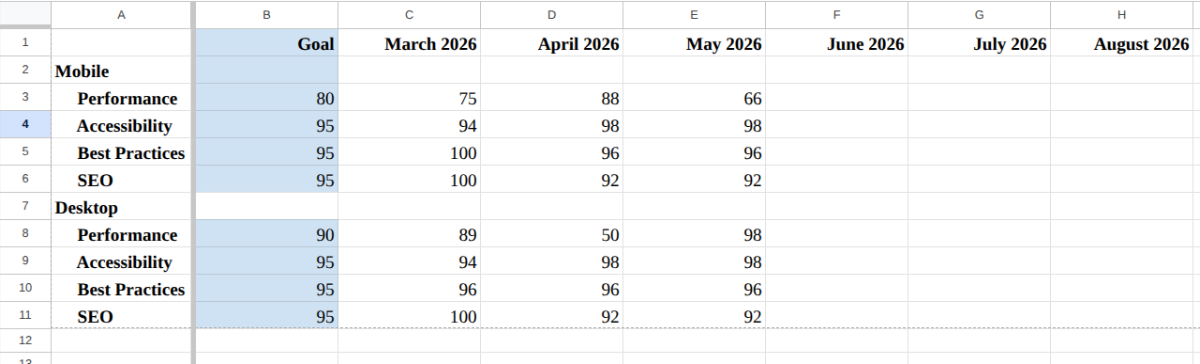
While 100 would be an ideal score for the four core web vitals, it’s not necessary. Sure, Google looks favorably on websites that perform well in these four areas, there are so many other factors that go into ranking. So, I’m not going to go crazy trying to achieve a perfect score. With the exception of Mobile Performance, all of my goals are in the green zone (90 to 100), even if they’re not perfect 100s.
I also think it’s important to consider the context of what you’re working with. For some webpages (especially on mobile), it’s really hard to get your score into the green no matter what you do. So, my goal is to improve from month to month whenever possible.
As you can see, we experienced a major drop last month in mobile Performance after I redesigned the homepage. So I spent this past month reworking it and optimizing it for speed. I’m confident that when I check again in July, we’ll be back up over the goal line.
This is why we include these relevant details in the data pull. It gives us a frame of reference as to where we came from, where we’re at and where we need to go.
3. Write the Report for Your Intended Audience
Now let’s move over to the summary and analysis side of things.
When writing these reports, it’s important to take into consideration who will be reading and using the report.
For example, I have one client who prefers a TL;DR (too long; didn’t read) approach. They have outsourced all of their marketing and advertising to me, and would prefer I take the reins. At the same time, they want to make sure they’re seeing an ROI on the work I do.
So, I send their summary over email vs. putting it into a document. It’s one less click, step and hurdle to keep them from seeing the report.
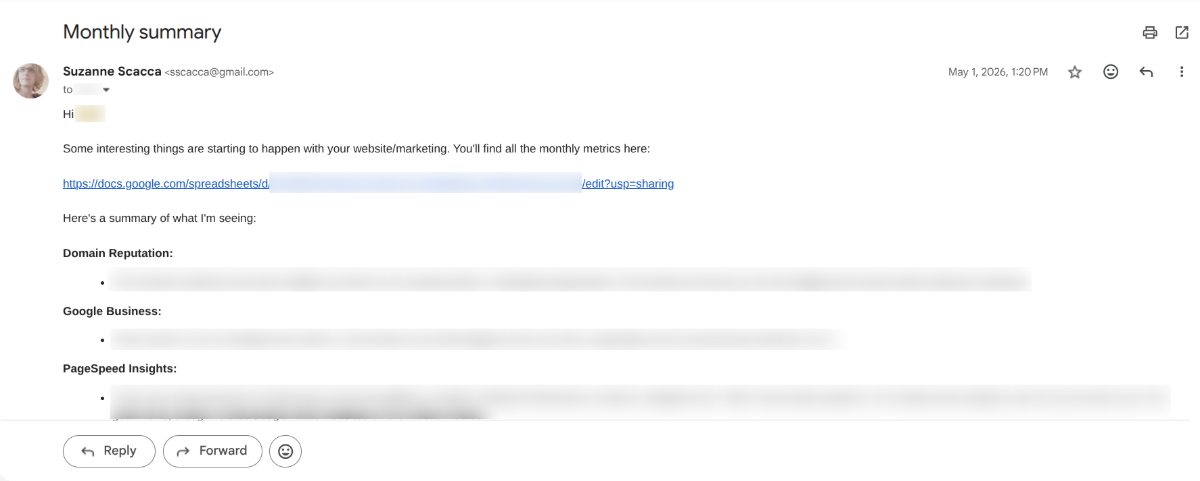
I keep it as short as possible, highlighting the most important points under each marketing channel I manage. I call out unexpected changes, big wins and ongoing trends. I also include any changes I plan to implement in the strategy.
Now, for other clients, I prepare more in-depth reports.
I create a branded (to them, not me) document with a consistent layout from report to report. Within it, I include:
- A formal summary cover page
- Explanation about why I believe this month’s performance turned out as it did
- Details about any changes I plan to make in the next month
- Deep analysis for each of the data sets I looked at
- Summary at the end with a list of action steps I plan to take
If you’re not sure how your client will receive the report you’ve prepared, start with something formal. If it’s too much for them, cut back to a more concise summary email and see if that gets them interested.
One other thing I’d recommend is incorporating citations. For example, I sometimes include external reference points to support some of my insights and recommendations. It just depends on who the client is.
For instance, whenever I do email marketing, I include a link to the recent study on the average and optimal open rates by industry, like this Klaviyo post. This way, if my client wonders why I set the goal open rate to 33.1% for their ecommerce shop, I can point them to real user data.
4. Organize Your Report
One thing I do for all my reports is to organize them. Not only does this mean breaking them up into sections with well-labeled headings, but I put the data in a logical order. For instance, I’d never place MailChimp data at the top, followed by Google Analytics, Facebook and Google Business.
To me, the headings tell a logical story, so they need to be ordered accordingly. I prefer to start at a high level with domain reputation, move to the website or app, tackle SEO and PPC, and then cover the different marketing channels (social media, email, etc.) last.
Whenever possible, I like to integrate data visualizations so the client doesn’t have to refer back to the data set. But I try not to overdo it. I don’t want to embed every table from the spreadsheet or the marketing platforms. I just use them to emphasize or elaborate on the points that need it.
For example, this is a “report” I created for this article:

It’s full of Lorem Ipsum text, so there’s nothing meaningful here. I just wanted you to get a sense for how these types of documents can be ordered and how to integrate data visualizations to keep things visually interesting.
I would also recommend writing these sections the way you would the content of an email or website. Shorter paragraphs are best. If you can use bullet points to list out data or recommendations, that would be helpful, too.
Wrapping Up
I know that marketing reports might not be the most exciting thing to prepare. But they’re incredibly beneficial for both you and your clients.
A well-prepared analysis (be it short or long) can point you to what’s working so you can reinforce those practices, and also show you what’s not so you can adjust your strategy. Instead of reacting when something hasn’t been working, you can proactively align your decisions so you get the best outcome.
For clients, it gives them a level of transparency needed to fully trust you. When it comes to something like organic marketing, it can take some time before they see the results of it in terms of leads, sales and so on. But that doesn’t mean that you need to stay quiet until then. These marketing reports can show how your work is slowly moving the needle forward—increasing their online brand authority, bringing in more traffic and more.
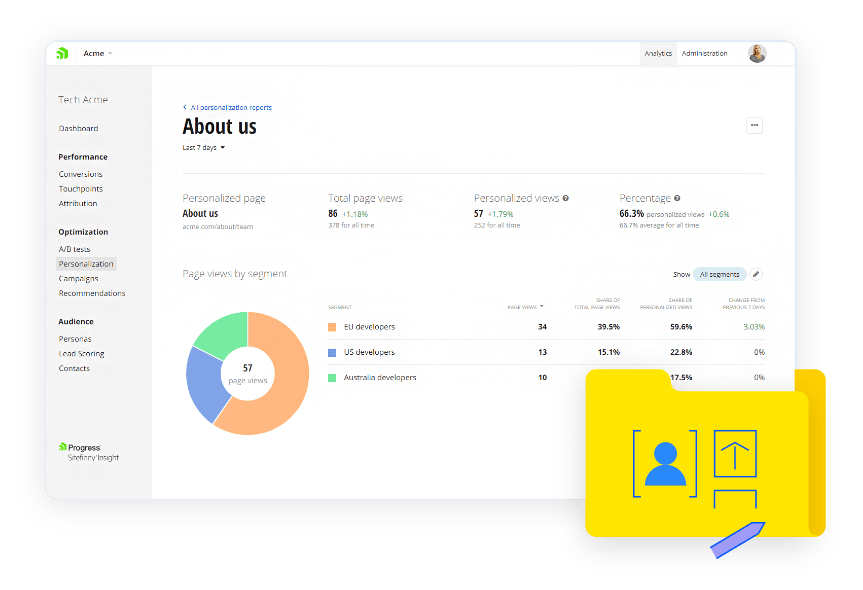
Learn about the tools available with Progress Sitefinity Insight analytics right inside your CMS.
Enjoyed this article?
Add Progress as a preferred source to see more of our content in Google search.
Add Progress as a preferred source on Google
Suzanne Scacca
Freelance Writer & Consultant

