JDBC TUTORIAL
Connect and Query Google Analytics Using Tableau
Updated: 26 Feb 2021
Introduction
Google Analytics is a web analytics service offered by Google that tracks and reports website traffic, currently as a service inside the Google Marketing Platform.
Google Analytics is used to track website activity such as session duration, pages per session, bounce rate and a host of other metrics of individuals using the site, along with the information on the source of the traffic. It can be integrated with Google Ads, with which users can create and review online campaigns by tracking landing page quality and conversions (goals). Goals might include sales, lead generation, viewing a specific page, or downloading a particular file. Google Analytics' approach is to show high-level, dashboard-type data for the casual user, and more in-depth data further into the report set.
Google Analytics offers access to all of this important data via APIs. However, APIs are notoriously difficult to use within SQL-enabled tools used for data integration, business intelligence or analytics. What if you don’t want to use the out of the box reports that Google Analytics provides or wish to use a different Business Intelligence tool such as Power BI or Tableau? Progress DataDirect’s Google Analytics JDBC connector will enable you to unlock this data to be used seamlessly with any SQL-enabled tool.
Download and Install the Progress DataDirect Google Analytics JDBC Connector
- Download the Progress DataDirect Google Analytics JDBC connector.
- Installing the connector:
- If you are on Windows, extract the PROGRESS_DATADIRECT_JDBC_GOOGLEANALYTICS_6.0.0_WIN.zip and run the PROGRESS_DATADIRECT_JDBC_INSTALL.exe to install the JDBC connector.
- If you are on Linux, extract the PROGRESS_DATADIRECT_JDBC_GOOGLEANALYTICS_6.0.0.zip and run the PROGRESS_DATADIRECT_JDBC_INSTALL.jar to start the installation.
- After you have completed the installation, you can find the Progress DataDirect Google Analytics JDBC connector.
- On Windows, you will find it at C:\Program Files\Progress\DataDirect\JDBC_60\lib\googleanalytics.jar
- On Linux, you will find it at /home/<username>/Progress/DataDirect/JDBC_60/lib/googleanalytics.jar
Configure Connection to Google Analytics Using the Configuration Manager
- The Progress DataDirect Google Analytics JDBC connector comes with a JDBC Configuration Manager that helps you easily configure the connection to your Google Analytics instance.
- To launch the Google Analytics JDBC Configuration Manager, double click the googleanalytics.jar or run using java -jar googleanalytics.jar
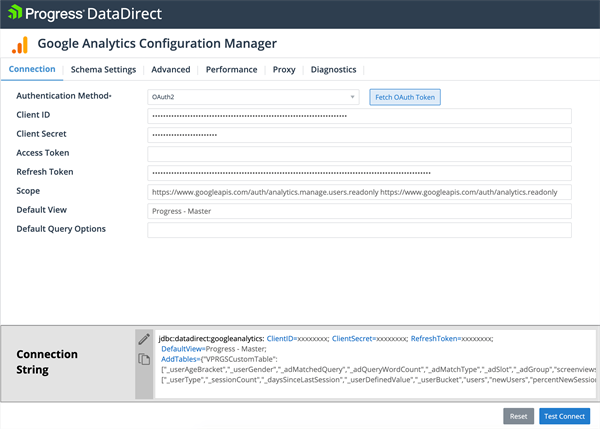
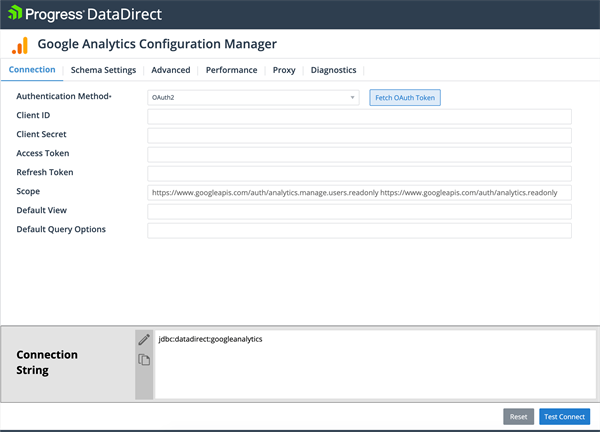
- You should now see the configuration manager (below) launched in your browser
- Choose the Authentication Method you want to use from the drop down. The Google Analytics connector only supports OAuth2 for authentication. The following are required in order to successfully authenticate:
- Client ID
- Client Secret
- Refresh Token
- Scope (the value for this parameter is pre-populated)
- Default View – this parameter is optional and can be found in the administration section of your Google Analytics dashboard. If a value for default view is not specified, then “View ID” will need to be specified in a WHERE clause for each SQL query.
- Much of the analytics data that is accessible by the connector can be found in a table called “Data”. By default, this table is hidden due to the volume of data stored and the challenges in formulating useful queries. The challenge stems from the fact that this table contains well over 300 measures and dimensions.
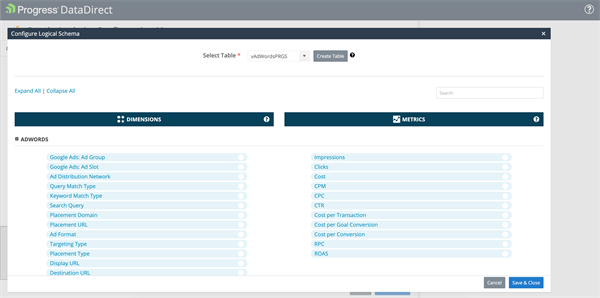
- The Configuration Manager can be used (below) to create views based on the out-of-the-box measures and dimensions that Google Analytics supports. This enables you to create very targeted views based upon the data you want to query instead of using the generic “Data” table.
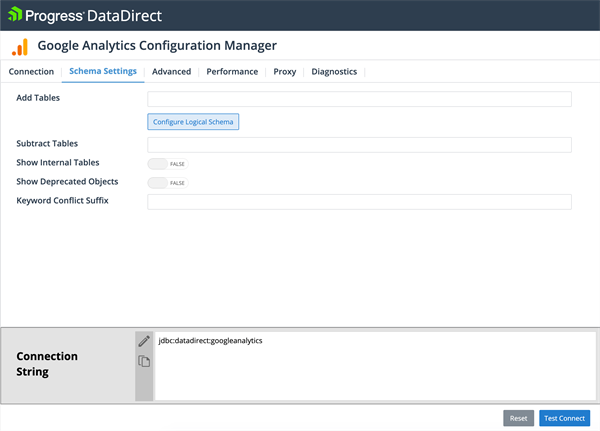
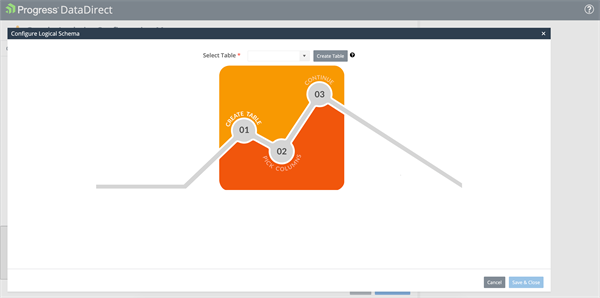
- To create a view, go to the “Schema Settings” tab in the Configuration Manager and click on “Configure Logical Schema”.
- Click on “Create Table” and provide a name.
- Google Analytics comes with many out-of-the-box measures and dimensions to create your view from. Each dimension and measure is listed within its associated section such as AdWords, AdSense, Audience, DoubleClick Campaign Manager, Page Tracking and so on. A limited number of measures and dimensions can be selected for each view being created.
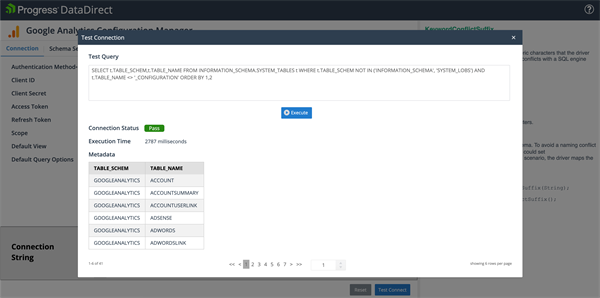
- Click on “Test Connect.” Now you should see the list of tables and views exposed by the Progress DataDirect Google Analytics JDBC connector.
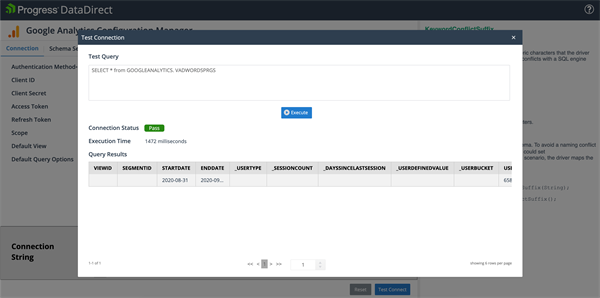
- Here you will be able to write some ad hoc SQL queries to better understand the Google Analytics data model and any custom views that you may have created. The configuration manager creates a JDBC connection string dynamically based upon the properties defined. You can copy the JDBC connection string so that you can start using the Progress DataDirect Google Analytics JDBC connector with other applications or in your applications.
Creating Reports by Connecting Tableau to Google Analytics
Below you will find some examples of using the Progress DataDirect Google Analytics connector with Tableau. Keep in mind that the Google Analytics connector can be used with any JDBC or ODBC-compliant application.
- To get started, copy hubspot.jar from the Progress install location to Tableau’s driver location:
- For Windows: copy hubspot.jar to C:\Program Files\Tableau\Drivers
- For Mac: copy hubspot.jar to ~/Library/Tableau/Drivers
- Open Tableau and create a new data source.
- Select “Other Databases (JDBC)”, copy and paste the JDBC connection string created above using the Progress DataDirect Configuration Manager into the “URL” textbox.
- Click “Sign In” which will have the driver connect to Google Analytics, normalize the API data from all supported endpoints, and Tableau will then display the relevant metadata (below). The image below shows the “GOOGLEANALYTICS” schema which contains default tables and any custom views created.
- Tables (one or more if a relationship across them can be defined), views or custom SQL can be used to retrieve the necessary data for your report. In the examples below, we’ll be using a combination of different approaches: custom SQL (depicted below) and standard tables.
- Creating reports is easy in Tableau once you’re able to access the data that is important to you. Below is a report that displays data from the “WEBPROPERTY” table.
- A second report displayed below uses a custom SQL query from the “DATA” table. It provides a geographical representation of the number of user sessions across a property ID segmented by gender.
- And a final report adding additional dimensions to further segment the data using custom SQL. In the report below, we’ve added the “_BROWSER” and “_COUNTRY” dimensions to get a breakdown of sessions across a specified property ID.


Conclusion
We hope this tutorial helped you to get started with the Progress DataDirect Google Analytics JDBC connector and connect to your data in Google Analytics. Feel free to contact us if you have any questions about using the connector and we will be happy to help you.