
When using a MarkLogic Data Hub to tackle tough data integration projects, you can go a long way without the need to write any code at all.
But eventually you’ll need to program the Data Services that unlock the value of your curated data in your MarkLogic Data Hub. And you may even come across a custom requirement during the data curation process that requires you to extend the MarkLogic Data Hub platform by programming a custom mapping function or a custom data curation step for your project. For those tasks, the Data Hub provides a JavaScript runtime that allows you to write custom code that runs close to the data.
Whenever you start writing code, it’s important that you have supporting tools to help you be as efficient and effective as possible. That’s why we’re really excited to announce the MarkLogic extension for the popular (and free!) Visual Studio Code IDE.
The extension provides:
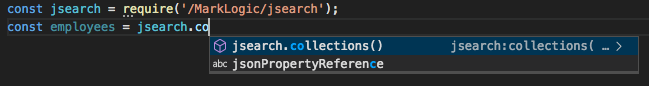
- Syntax highlighting and IntelliSense for MarkLogic JavaScript and XQuery APIs.
- Real-time query evaluation to run code in your editor against a live MarkLogic instance in the cloud or on your laptop.
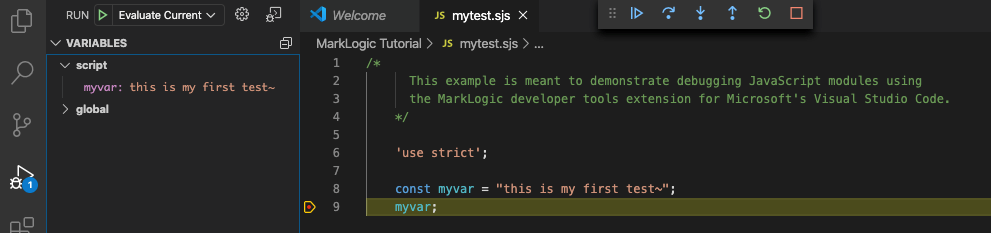
- Interactive debugging for JavaScript and XQuery
Check it out today and begin to reap the rewards of a more integrated and effective developer experience.
