Using Profiling to Develop Better ABL Code

Profiling your code can help you deliver a better quality product to your customers. Learn how to do it easily in the Progress Developer Studio for OpenEdge.
How many times have you heard from your customer that your application is responding slowly? How many hours have you spent tracking the whole issue? What if we can find these performance issues during the development phase? Imagine the number of hours saved and not hearing those disgruntled customers.
With OpenEdge 11.6, you can use the ABL Profiler within Progress Developer Studio to profile your code and find any performance issues. So, let’s talk about exactly what Profiling is and what the ABL Profiler provides for you.
What Is a Profiler?
In short, we can define profiling as “the process of systematically examining program execution times to learn the bottlenecks.”
Using Profiler, we can profile a particular execution flow or a particular module. A profiler generally provides timing information and call-tree information. With that, an engineer can analyze where their program is spending most of its time and what part of the application is calling what other part of the application. The main intention of profiling is to find any performance issues and to optimize the code.
ABL Profiler
An ABL Profiler has long existed through which you can profile the ABL code. What was missing was tighter integration with the Progress Developer Studio for OpenEdge (PDS OE), which most ABL developers use for their coding.
ABL Profiler is now integrated with Progress Developer Studio for OpenEdge. Users can now profile the code from within Developer Studio and can view the profiled data with a viewer in a very impressive format.
The PDS OE Profiler helps you by:
- Helping you find and fix the performance bottlenecks in your ABL applications.
- Providing you with a host of information about your ABL applications, like the execution time taken by each module, the number of times each module was called and also the time taken by each line.
- Showing you the call hierarchy of the execution, the execution path taken by your application.
How Do You Use Profiling in Progress Developer Studio?
A new tab called “Profiler” was introduced in Run Configurations. Once you are done with coding, if you want to profile your application, all you need to do is to launch “Run Configurations” and run the application by choosing the “Enable profiling” check box. This will generate a .prof file which will be opened in the “Profiler Viewer” as soon the execution of the ABL program is done. This profiler viewer is a multi-tabbed viewer which displays the profiled data.
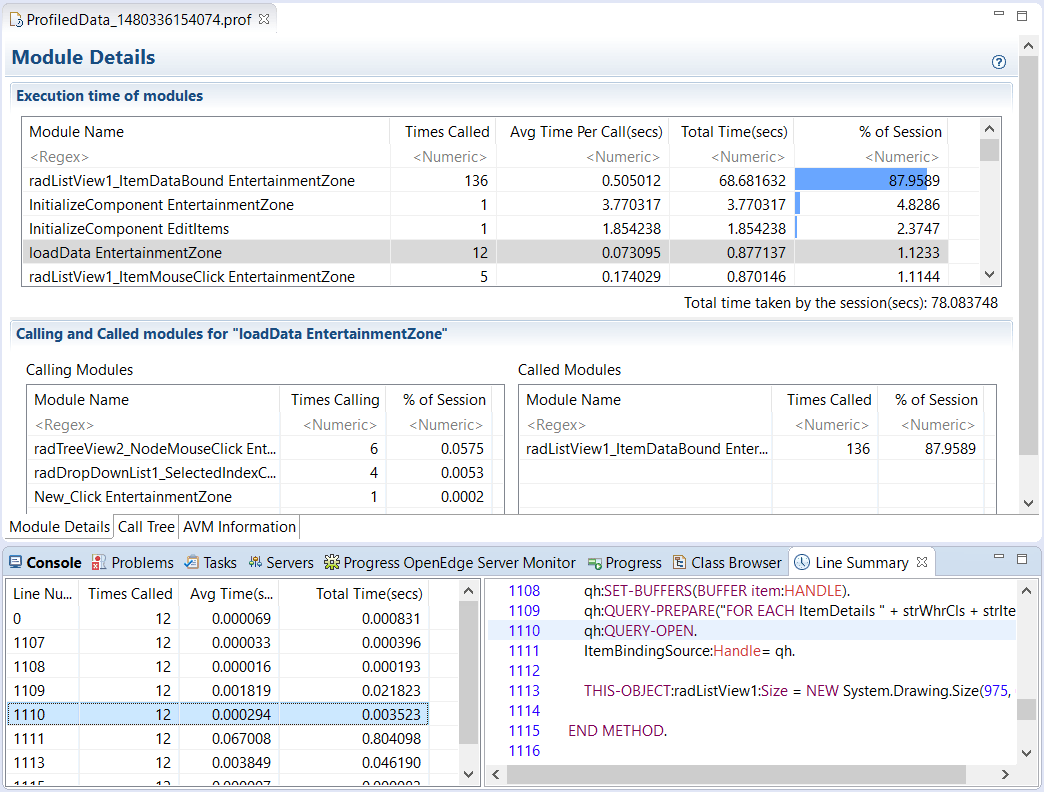
The first tab in the view “Module Details” will provide high level information on the execution time of the modules along with the details on number of times they were called, the average time and the line summary. Also there are details on Calling and Called modules for each module.

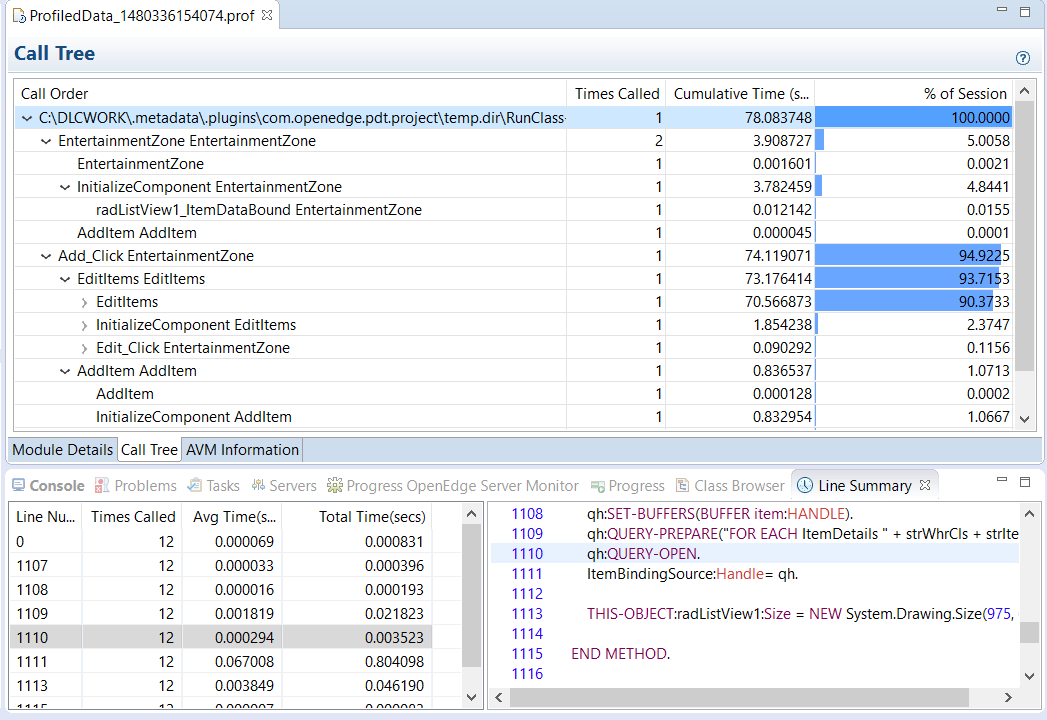
Now that we have information on the modules that consume higher time, the next step is look at the hierarchy of the whole Call tree execution and the execution path taken by your application. This is what will be provided in the next tab, “Call Tree.” This tab will display the order of the calls along with other information to evaluate the calls that take more time. The information in the “Call Tree” tab is only available when the User selects the “Enable Tracing” option from Run Configurations.

The third tab is “AVM Information” tab. It hosts the session and the database related information.
Deliver Better Quality Products
In short, the ABL Profiler from PDS OE will help you detect performance and scalability issues early in the cycle, will provide complete details on the code that’s causing the issues, thus making it easy to fix the problem. Just as with fully integrated unit testing, when we find performance issues during coding and fix them, we will in fact be delivering better quality products to our customers.

