Using OpenTelemetry Metrics Support in OpenEdge on Azure

The OpenEdge 12.6 release introduced support for OpenTelemetry Metrics with OpenEdge Command Center 1.2.
OpenTelemetry is a vendor-neutral open-source observability framework for instrumenting, generating, collecting, and exporting telemetry data such as traces, metrics, logs. It standardizes the way telemetry data is collected and transmitted to backend observability platforms. Observability is the ability to measure the internal states of a system only using information from outputs, namely sensor data. for instrumenting, generating, collecting, and exporting telemetry data. As an industry-standard it is natively supported by a number of vendors.
Telemetry data is used to understand the performance and behavior of software.
Support for OpenTelemetry Metrics was introduced with OpenEdge Command Center 1.2 in the OpenEdge 12.6 release. The OpenEdge Command Center agents can collect performance metrics from the OpenEdge database and PAS for OpenEdge.To know more about monitoring OpenEdge resources and the deployment architecture, please refer to the OpenEdge article Monitor OpenEdge Resources using the OpenEdge Command Center agent.
In this blog, we outline the steps on how to create a test infrastructure to use the OpenTelemetry Metrics Support for OpenEdge on Azure.
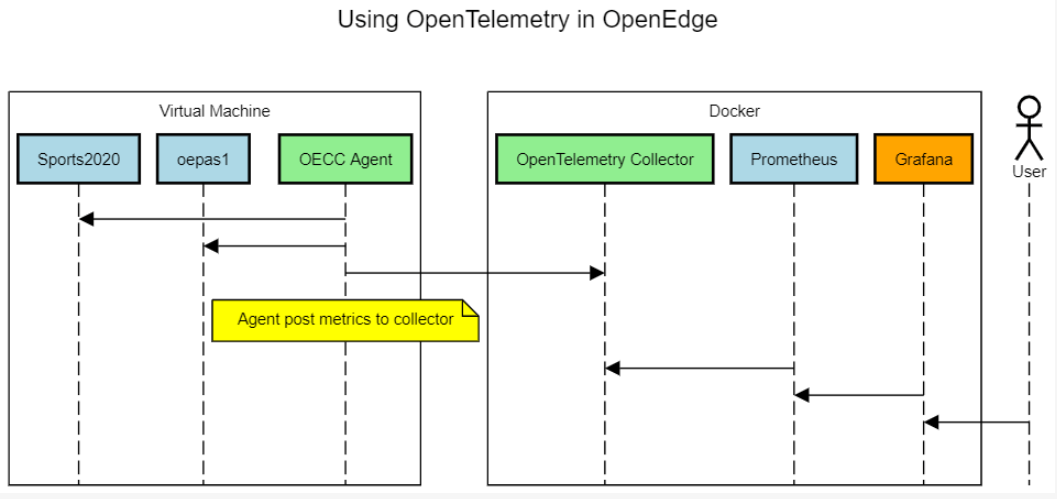
The infrastructure uses multiple components. To simplify the deployment, the test infrastructure uses a single virtual machine. Some components are run at the OS level and others are run as a container.
Components:
- Ubuntu Virtual Machine
- OpenEdge Database
- PAS for OpenEdge
- OpenEdge Command Center agent
- Docker
- OpenEdge Command Center server
- MongoDB
- Prometheus
- Grafana
Notes:
- OpenEdge Command Center server is not required for the collection of metrics.
Pre-requisites
The following files are required to create the infrastructure:
- PROGRESS_OE_12.6_LNX_64.tar.gz
- response_12.6.ini: response.ini file with your control codes for OpenEdge silent install (you can use the response_12.6.ini in https://github.com/progress/openedge-demos/blob/master/otlp/files/response_12.6.ini as a template)
- PROGRESS_OECC_SERVER_1.2.0_LNX_64.tar.gz
- PROGRESS_OECC_AGENT_1.2.0_LNX_64.bin
Steps
Creating the Infrastructure
In this section, we create the virtual machine to run the components used for OpenTelemetry Metrics Support and launch the Bash Cloud Shell environment in Azure to connect to it.
1. Connect to the Azure Portal using your own credentials.
2. Create a new Resource Group.
3. Create a new Virtual Machine named "TestVM" using the Ubuntu Server 20.04 LTS image from Canonical. Go to the resource and take note of the Public IP Address.
Notes:- Use SSH public key as the Authentication Type. Generate a new key pair to connect to the VM using SSH.
- Using the name "TestVM" would allow you to use a sample dashboard.
4. Launch the Bash Cloud Shell environment on Azure. In this blog, we use the Cloud Shell environment on Azure to connect to the VM. Alternatively, you can use SSH on your local machine.
Uploading the Support Files
In this section, we upload the support files to the machine.
1. Launch the Bash Cloud Shell environment on Azure. In this blog, we use the Cloud Shell environment on Azure to connect to the VM. Alternatively, you can use SSH on your local machine.
2. Upload the following files to the Cloud Shell:
- PROGRESS_OE_12.6_LNX_64.tar.gz
- response_12.6.ini
- PROGRESS_OECC_SERVER_1.2.0_LNX_64.tar.gz
- PROGRESS_OECC_AGENT_1.2.0_LNX_64.bin
- TestVM_key.pem
3. Change permissions of the TestVM_key.pem file:
chmod 400 TestVM_key.pem
4. Connect to the VM and create a /files folder:
ssh -i TestVM_key.pem azureuser@<Public IP Address>
On the VM run the following commands:
sudo mkdir /files
sudo chown azureuser:azureuser /files
Alternatively, you can use:
ssh -i TestVM_key.pem azureuser@<Public IP Address>
    sudo mkdir /files
ssh -i TestVM_key.pem azureuser@<Public IP Address>
    sudo chown azureuser:azureuser /files
5. Upload pre-requisite files to the VM:
scp -i TestVM_key.pem \
         PROGRESS_OE_12.6_LNX_64.tar.gz \

         response_12.6.ini \

 PROGRESS_OECC_SERVER_1.2.0_LNX_64.tar.gz \

 PROGRESS_OECC_AGENT_1.2.0_LNX_64.bin \

 azureuser@<Public IP Address>:/files
Setting up the Components
The setup.sh script installs OpenEdge, OpenEdge Command Center and open source components used for the test infrastructure:
- OpenEdge
- OpenEdge Command Center agent
- OpenTelemetry
- Prometheus
- Grafana
1. Connect to the VM and clone the OpenEdge Demos repo from GitHub:
ssh -i TestVM_key.pem azureuser@<Public IP Address>
On the VM run the following command:
git clone https://github.com/progress/openedge-demos.git
2. Run setup.sh from the ~/openedge-demos/otlp folder:
cd ~/openedge-demos/otlp
sudo bash ./setup.sh
3. Run test.sh from the ~/openedge-demos/otlp folder to confirm that the services are running:
cd ~/openedge-demos/otlp
bash ./test.sh
Accessing Telemetry Data using Grafana
In this section, we access the web interface for Grafana.
1. Add access to port 3000 on the VM in the Network Security Group (Virtual Machine / Networking).
2. Access Grafana at http://<Public IP Address>
3. Change the administrator password.
4. Add a Data Source for Prometheus using http://prometheus:9090 as the URL.
5. Click on Save & Test.
6. Click on Dashboards / Import on the sidebar.
7. Copy and paste the text of a sample OpenEdge Dashboard (https://github.com/progress/openedge-demos/blob/master/otlp/openedge-dashboard.json) into the “Import via panel json” editor.
8. Click on Load.
9. Click on Import.
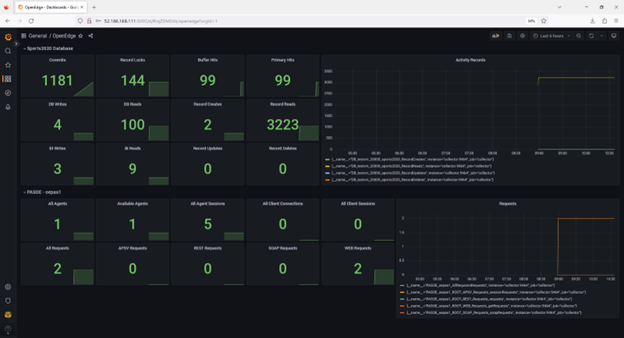
10. The sample OpenEdge dashboard should now show:
Conclusion
In this post we have learned how to create the infrastructure to use OpenTelemetry Metrics Support in OpenEdge on Azure.
How was your experience setting up and using this environment?
Would you like to create this test infrastructure on other cloud or virtualization environments?
Please let us know in the comments.
Thank you for reading.

