Graphical ETL Data Movement with Data Integration Suite | Sample

In the previous post I introduced you to the idea of using the Data Integration Suite as a way to deploy ETL functions for moving data from database and file formats into a new database. A complete list of the data sources you can use for ETL processes can be found at Data Source Support. The following post will walk you through a use-case for this functionality in where a source file in CSV format must be joined with data from an Oracle Database and then inserted into a Microsoft SQL Table for access by a custom application. A how-to video can also be viewed on the Nov. 9 blog post, "Graphical ETL Data Management with DIS."
1. You receive Customer Orders are received from flat files such as a CSV file in the following format
![clip_image002[7]](/images/default-source/blogs/4/files/2012/07/clip_image0027_thumb2.jpg?Status=Master&)
CSV Input
2. Your Sales Representative information is stored in an Employees Table within an Oracle Database (*could be any supported database)
![clip_image002[9]](/images/default-source/blogs/4/files/2012/07/clip_image0029_thumb.jpg?Status=Master&)
3. You need to join data from the incoming CSV with Oracle and then insert it into a SQL table “salesTable” with the First_Name and Last_Name of the Sales Rep extracted from the database according to the Employee_ID and then concatenated into the Rep column in the new database.
How do you do this?
- You would start by creating a new XQuery File
- In the mapper, you would select the CSV File as a source
- When selecting the file, convert the CSV into XML using XML Converter
- You can create a custom .conv file or leverage the default xml converters
- An XML representation of the source file is now available within the XQuery Mapper
![clip_image002[15]](/images/default-source/blogs/4/files/2012/07/clip_image00215_thumb.jpg?Status=Master&)
6. Next you need to add the reference to the source database through the file explorer window. This window is available through view/file explorer. Right click Relational DB and select New Server. Enter the URI and credentials for establishing a connection.
7. Select the desired table(s) and drag them to the source document
![clip_image002[19]](/images/default-source/blogs/4/files/2012/07/clip_image00219_thumb.jpg?Status=Master&)
8. This creates an XML representation of the database table schema
9. Now you want to set up a connection to your target database using the same method as above. Once the connection is established, you will select the desired target table and drag it into the middle/mapping pane. In doing this, you will be presented with a context menu stating Create SQL Insert Call and Create SQL Update Call
![clip_image002[21]](/images/default-source/blogs/4/files/2012/07/clip_image00221_thumb.jpg?Status=Master&)
10. Choose the Insert Call and it will place a function block and the sql-insert query command within the XQuery Source pane.
![clip_image002[23]](/images/default-source/blogs/4/files/2012/07/clip_image00223_thumb.jpg?Status=Master&)
11. Double-click the function block to expand the context of the block showing the columns of the table.
12. Once expanded, you can now map values to the columns of the target table. You will also note that it is linked to a Dynamic Document Node as a target. This is due to the Query writing to the table as opposed to a target document.
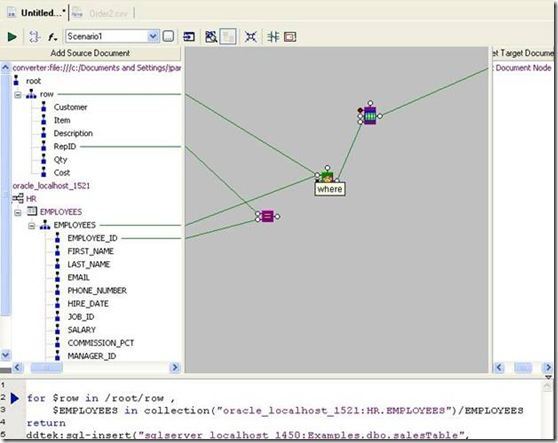
13. Right-click within the mapper pane and select the FLOWR Block. Link the Row Node of the source to the FLOWR “For” port
14. Link the Employees Node of the Employee Table. By linking both the top node of the source document and the database, you tell the query to pull data from both sources.
15. Use a compare function to join the CSV File to the Source Table by finding every occurrence where the RepID = Employee_ID
16. Link the output of the compare to the where port of the FLOWR block. Now you have set up the logic to successfully bring back every occurrence where a match between both sources exists. The join function will allow you to now map fields from both sources to columns of the target table.
17. Using a string function concat, you can now join together the First and Last name fields from the database to insert into the rep column of the target.
![clip_image002[41]](/images/default-source/blogs/4/files/2012/07/clip_image00241_thumb.jpg?Status=Master&)
18. Add an argument port to the concat function block to allow a concatenation of the First_Name, a space represented as “ “, and the Last_Name column to create a format like “Tom Smith”
![clip_image002[39]](/images/default-source/blogs/4/files/2012/07/clip_image00239_thumb.jpg?Status=Master&)
19. Link the Last_Name to the last port. Link the output port to the Rep port of the SQL-Insert function
20. Complete the links from the data sources to the desired columns in the target table
![clip_image002[33]](/images/default-source/blogs/4/files/2012/07/clip_image00233_thumb.jpg?Status=Master&)
21. Run the query and you will see data insert into your target table as expected.
![clip_image002[37]](/images/default-source/blogs/4/files/2012/07/clip_image00237_thumb.jpg?Status=Master&)
So to summarize, through this example you can now see how DIS can be used to create customized ETL functions through the graphical mapping interface. Here is a video I prepared for you showing this scenario coming together. By taking these fundamentals and adding functionality to fit your needs, you will be able to quickly and easily develop transformations that can then be deployed within your environment. (Click on the video to view full screen)
 <!--[endif]-->
