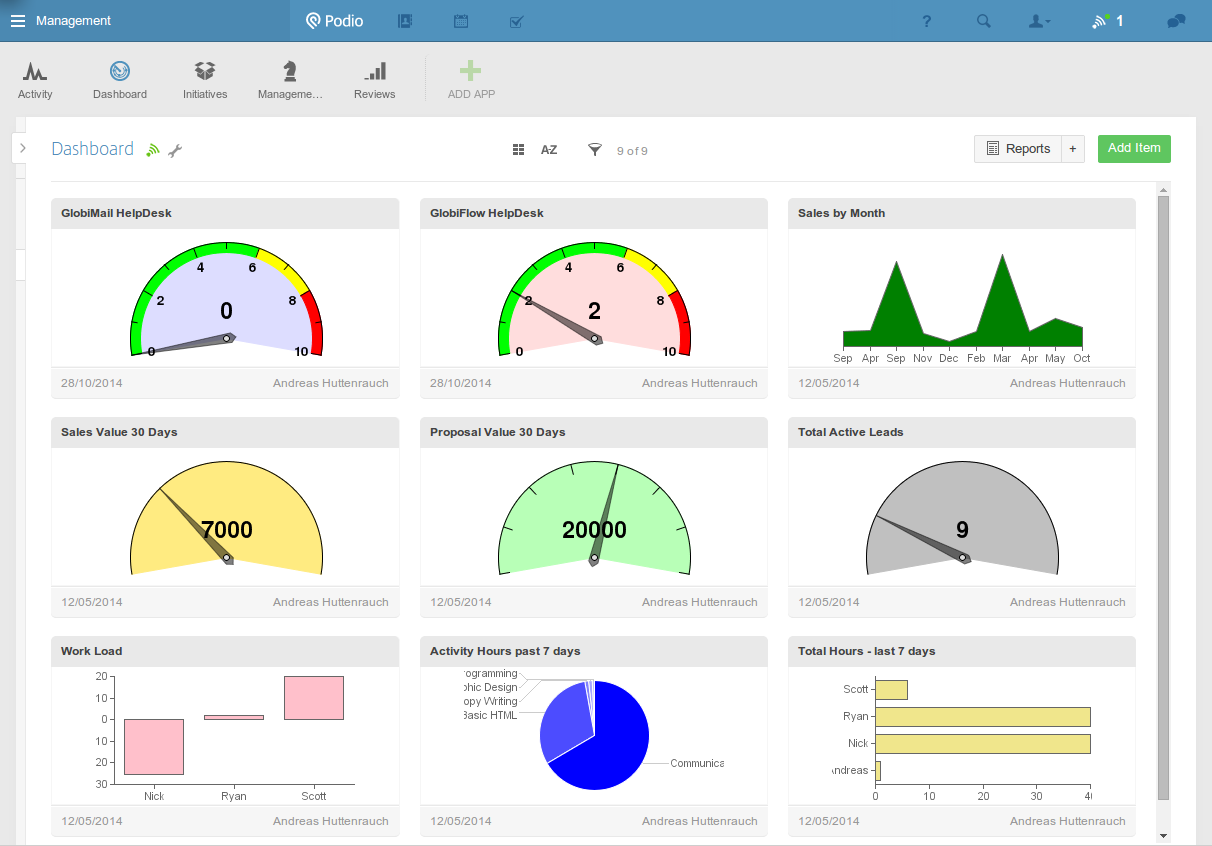
Building a Dashboard App in Podio
We've already covered how to Create Image Charts from report widgets. Most people add these to an app's sidebar or to a workspace sidebar.
Now Podio users has the option to get a dedicated Dashboard "INSIDE" Podio. Something like this:
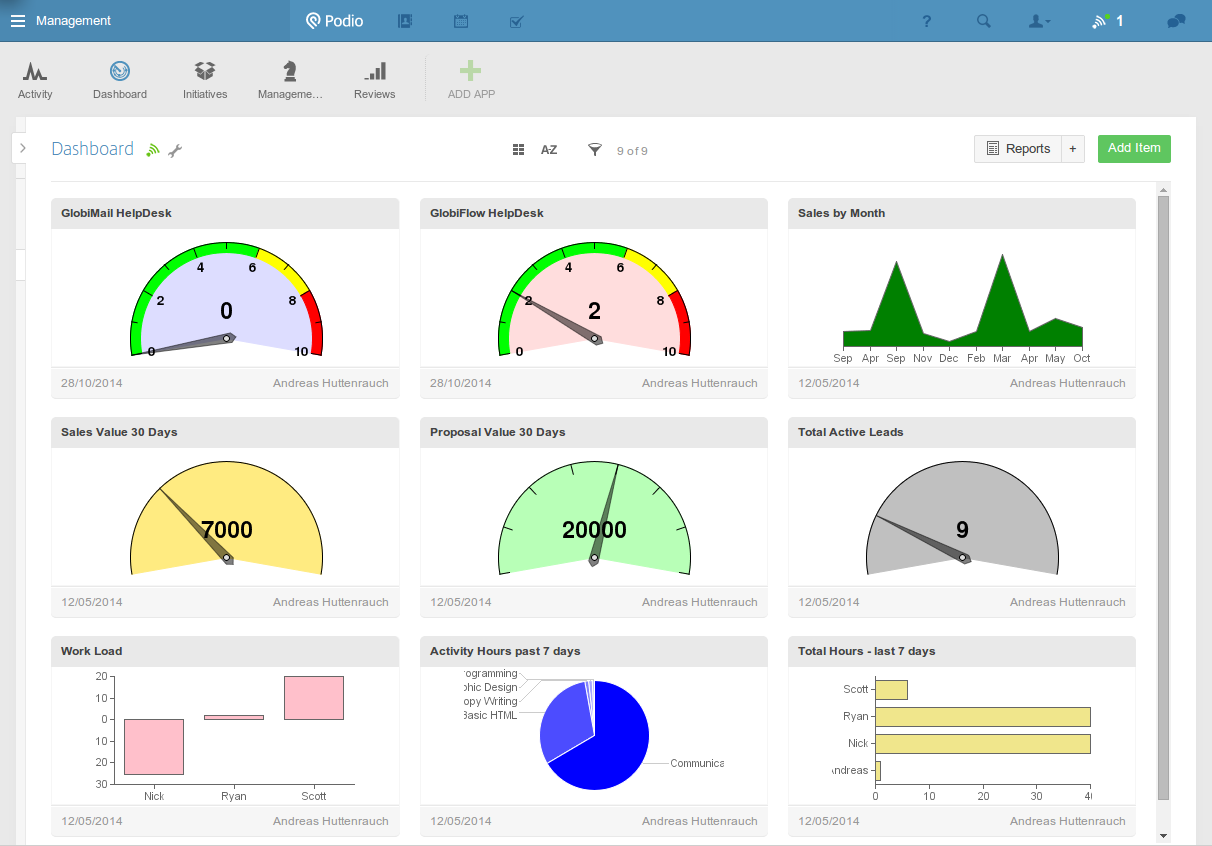
It's actually quite easily done.
-
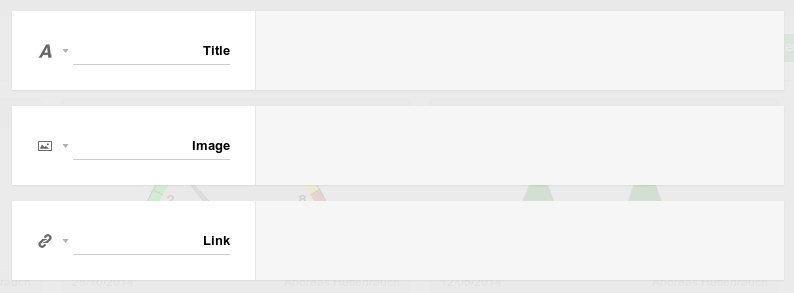
What you'll need is a dedicated Dashboard App with 2-3 fields.
-
A Title (single-line text)
-
An Image
-
An optional Link
-
-
Once you have your Dashboard App, create all the items you want shown that you will have charts for. For example:
- Sales by Month
- Proposal Pipeline
- Help Desk Issues
- Etc
-
Navigate to Workflow Automation, and for each chart, add another destination, but this time specify an Item. This let's you tell Workflow Automation which specific item and field to save the chart to.
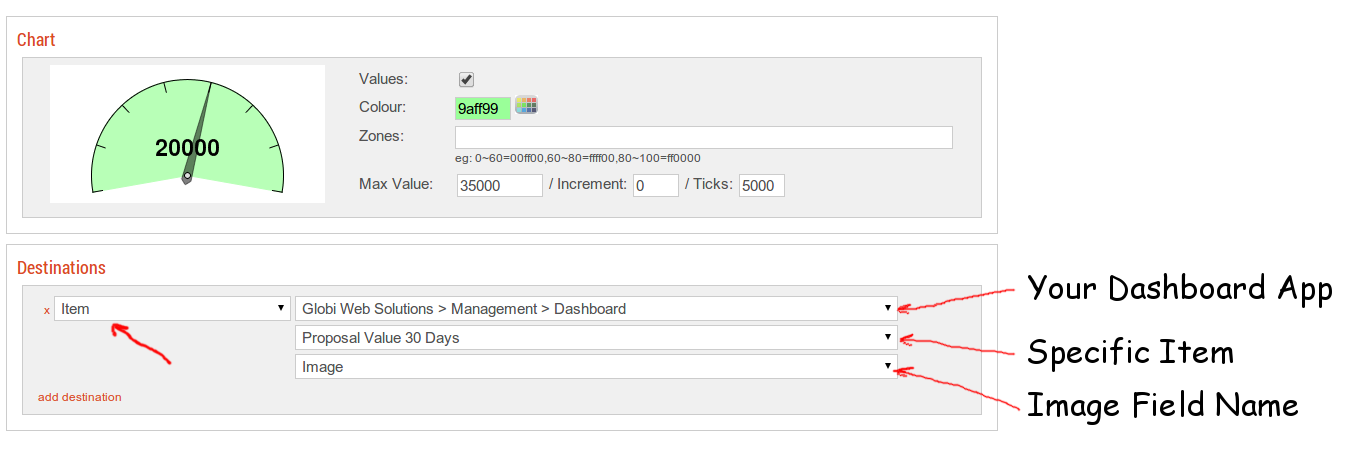
-
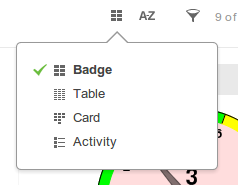
Once you've given all your charts a destination item in your Dashboard App, change the view of the Dashboard App to Badge:
And voila! You now have a Dashboard in Podio: