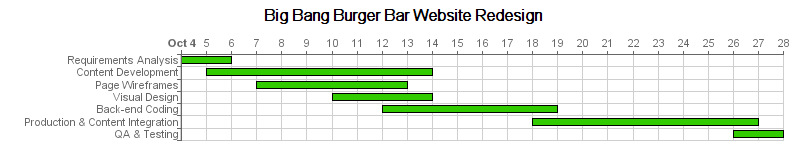
Adding a Gantt chart to Podio Projects
Very often it's desirable to see a visualization of a project's timeline in a gantt chart. With our new charting features, this can quite easily be done.
The Setup
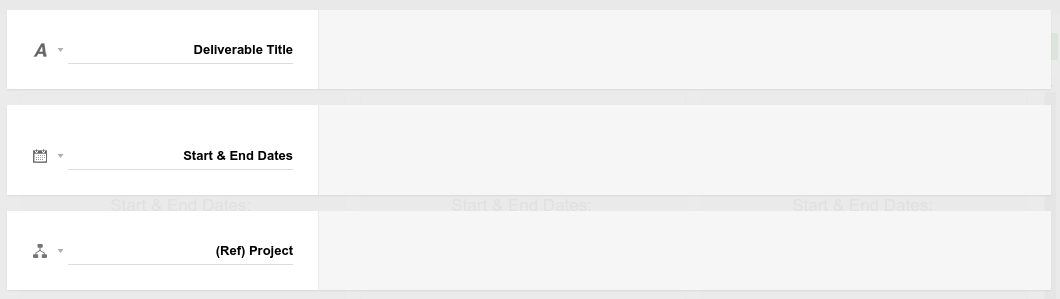
For this example, I'm going to use only the most necessary fields. We have a Projects app with an image field for the gantt chart, and a Deliverables app which has:
-
a relationship field to Projects
-
a Date field for the start and end date of the deliverable
The Flows
There are a few ways to achieve our desired goal, but here I'll present what appears to be the simplest solution.
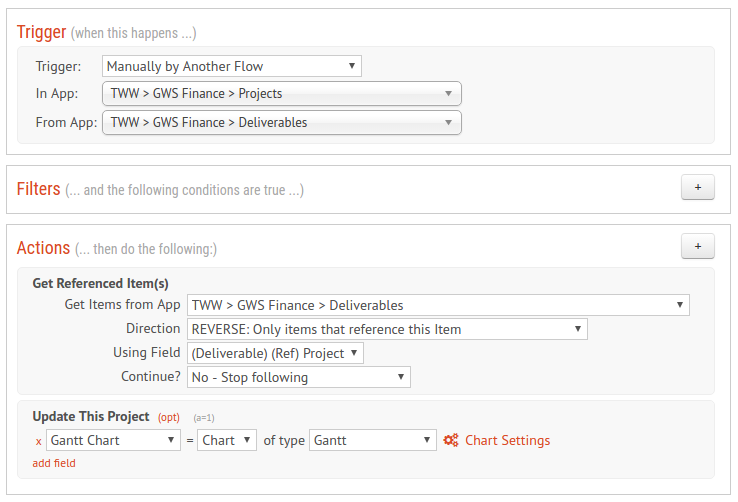
We'll need a manual flow in Projects to generate the gantt chart. This flow would:
-
Get all referenced Deliverables
-
Update the image field with a gantt of the Deliverables
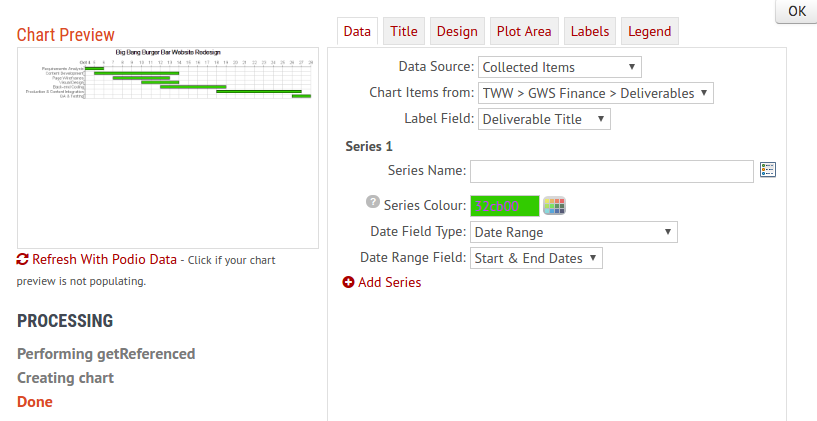
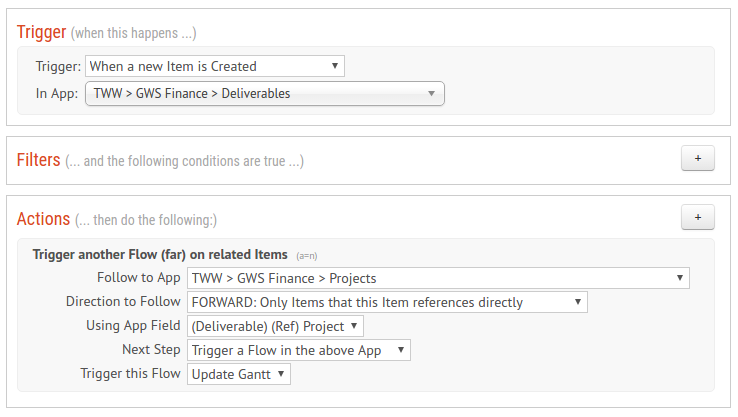
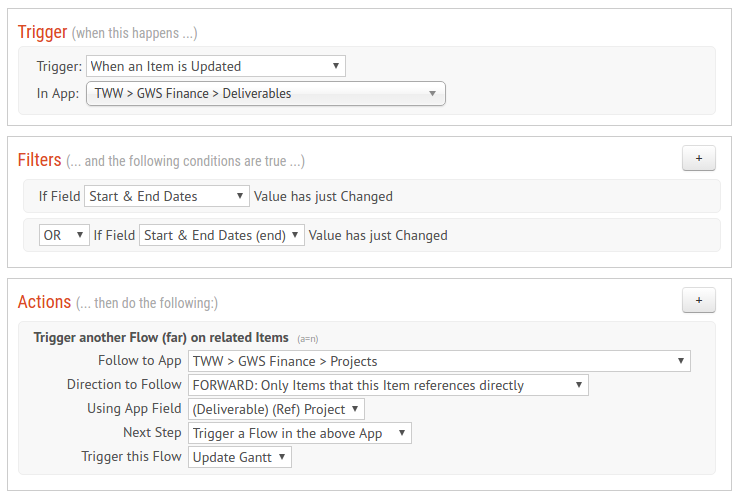
Then we'd need another 2 flows in Deliverables app to trigger the chart flow above anytime a Deliverable is created, or the date range of a Deliverable is changed:
The Result
Now, anytime a Deliverable is added or has it's date range changed, a new Gantt chart will be placed in the Project item.