Use the Analytics map
IMPORTANT: Sitefinity CMS Analytics module is unavailable after July 1, 2024, because it depends on the discontinued Google Universal Analytics. We recommend using Sitefinity Insight and the Script manager (available in Sitefinity CMS 14.3 and later) to integrate another analytics solution.
The Analytics map is a geographic map of the world that depicts your website visits and other indicators, such as use of mobile devices to access your website. The data is displayed per countries, per regions, and per cities. Use it to analyze the distribution of data around the globe and to localize the geographic areas that generate most of your website traffic.
You can display a geographic distribution of every report in Analytics. The data displayed in the main chart of the report can also be displayed on the map of the world.
- To view the Analytics map, open the desired report and in the upper-right corner, click Map button.
NOTE: A geographic map can display only one dimensional reports – for each country, region, or city, the system can display the value of the chosen indicator. Therefore, you cannon display a stacked area chart on a map. In this case, when you click Map, the system displays only the cumulative values. For example, if you open the New vs returning visitors report an click Map, the system displays the geographic distribution of all visitors. If you open the detailed report of new visitors only and then click Map, the system displays the geographic distribution of new visitors.
The map of the world appears.
For all countries, which have generated data for the indicator displayed in the main chart, the system displays a square like this one  . The color of the square varies depending on the contribution of each country. The system calculates the percentage contribution of each country and displays squares from light green to dark blue, meaning lower and higher percentage, respectively.
- To zoom in and out use the scroll button of your mouse or use the use the buttons in the lower part of the map. To pane the map, use your mouse.
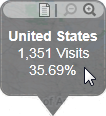
- To displays the name of the country and the value of the indicator this country for the selected time interval, hover over the square.
The following is an example of hovering over the small square of USA:
- You can open the detail report for this country, by clicking
 (View Detailed Report).
The system opens the respective country, region, or city detailed report containing an area chart of the number of visits from this country, region, or city only, together with the values of the main indicators for this country.
- You can zoom in and out of the current level, using the buttons in the upper-right corner.
For example, if you are viewing data on regional level, you can zoom in city level or zoom out to country level.
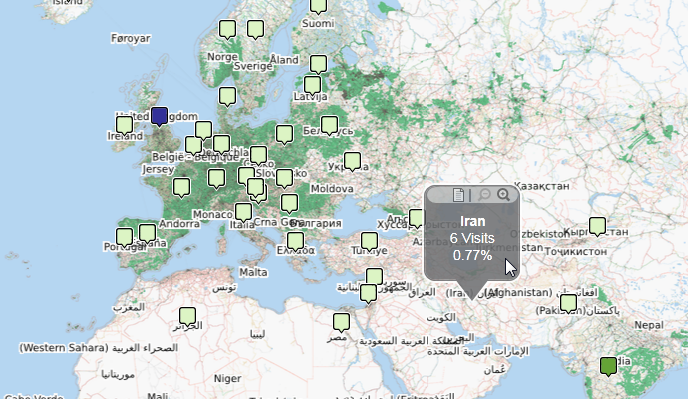
- The following screenshot displays European and Asian visits, using DSL connection, for the selected time interval on country level, where Iran is contributing with 6 visits:
 enlarge screenshot
NOTE: For countries, from which there are no visits of your website for the chosen indicator for the selected time interval, the system does not display a square.
- To further analyze the geographical distribution of the visits, zoom the map until you see a more detailed regional view.
For each region that has generated visits, the system displays a square.
- To displays the name of the region and the number of visits from this region for the selected time interval, hover over the square.
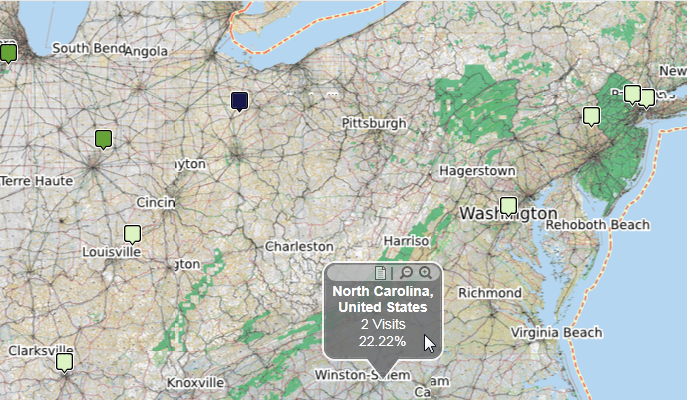
The following screenshot displays visits from the United States, where each square represents a state. In this case North Carolina is contributing with 2 visits:
 enlarge screenshot
NOTE: For regions, from which there are no visits of your website for the selected time interval, the system does not display a square.
- To further analyze the geographical distribution of the visits, zoom the map until you see a more detailed city view.
For each city that has generated visits, the system displays a square.
- To displays the name of the city and the number of visits from this city for the selected time interval, hover over the square.
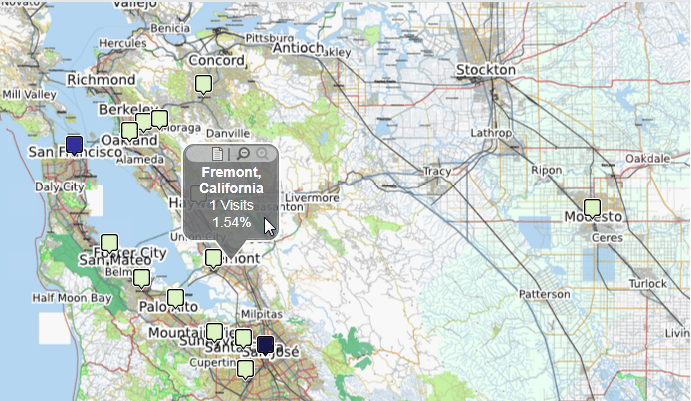
The following screenshot displays visits from San Francisco region on city level, where the city of Fremont is contributing with 1 visit:
 enlarge screenshot
NOTE: For cities, from which there are no visits of your website for the chosen indicator for the selected time interval, the system does not display a blue square.
- To display back the region and country level statistics, zoom out the map.