Grouping of data
IMPORTANT: Sitefinity CMS Analytics module is unavailable after July 1, 2024, because it depends on the discontinued Google Universal Analytics. We recommend using Sitefinity Insight and the Script manager (available in Sitefinity CMS 14.3 and later) to integrate another analytics solution.
In Analytics you can group the data on a daily, weekly, or monthly basis. The grouping is applied to all indicators. Usually monthly grouping is more meaningful for longer time intervals, such as a year or two, while daily grouping is suitable for short interval, for example, 7 days.
You can change the grouping at any time by clicking one of the following in the Group by: button group:
- To display data on a daily basis, click
 (Day).
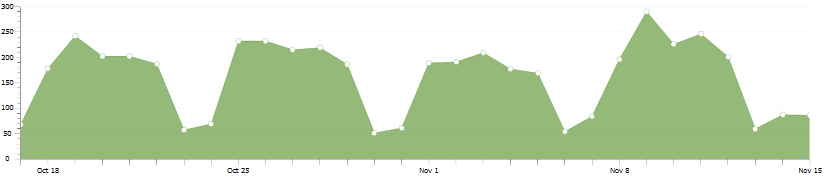
The data is summed for every day and every day is represented by a point in the chart.
The screenshot below displays data for the time interval of 17th October until 15th November, grouped on daily basis:
 enlarge screenshot
- To display data on a weekly basis, click
 (Week).
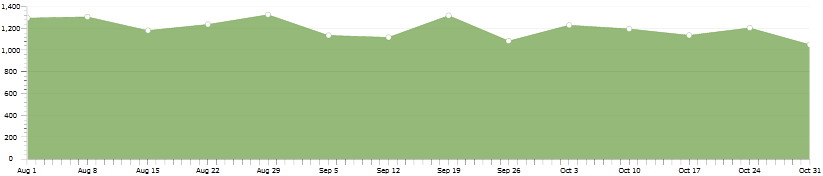
The data is summed for every week and every week is represented by a point in the chart.
The screenshot below displays data for the time interval of 1th August until 31th October, grouped on weekly basis:
 enlarge screenshot
NOTE: If as the first day of the time interval, you have selected a day that is not the begging of the week, the system automatically calculates which the first day of that week is and the data, displayed in the chart, starts from that day. All other data also starts to be calculated from that day. If as the last day of the time interval you have selected a day that is not the end of the week, the system automatically calculates which the last day of the previous week is and the data, displayed in the chart, ends at that day. All other data also stops to be calculated at that day.
- To display data on a daily basis, click
 (Month).
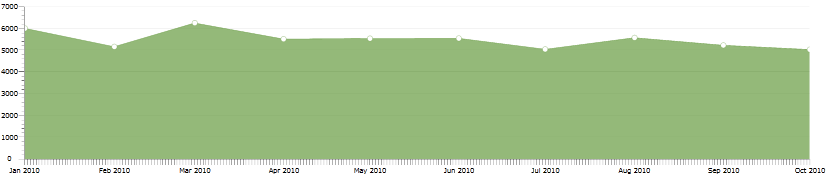
The data is summed for every month and every month is represented by a point in the chart.
The screenshot below displays data for the time interval of 1th January until 1th November, grouped on monthly basis:
 enlarge screenshot
NOTE: If as the first day of the time interval, you have selected a day that is not the begging of the month, the system automatically retrieves data for the entire month and the data, displayed in the chart, starts from the first day of the month. All other data also starts to be calculated from the day of that month. If as the last day of the time interval you have selected a day that is not the end of the month, the system automatically calculates which the last day of the previous month is and the data, displayed in the chart, ends at that day. All other data also stops to be calculated at that day.