Troubleshooting
Overview
Sitefinity Cloud provides easy access to the tools and resources needed to troubleshoot problems with your project. The key components that are available to allow efficient troubleshooting process are the logs, database backup, and source code files.
The source code of your decoupled Renderer application is stored in a code repository in the Sitefinity Cloud Management Portal. In a Sitefinity Cloud PaaS setup where the Developer Extensions toggle is enabled, the source code of the Sitefinity CMS application is also stored in the Sitefinity Cloud Management Portal. This provides an interface for developers to see what code is currently deployed and clone it locally to troubleshoot any issues, or implement new functionality.
For more information, see Setup the project for local development (using Sitefinity CMS).
For Sitefinity Cloud PaaS setup where the Developer Extensions toggle is enabled: Your project database is backed up on regular time intervals and in addition, you can create on-demand backups. You can use these backups to restore a local copy of the project database.
For more information, see Backup and restore the database.
Logs
Sitefinity Cloud provides comprehensive logging to assist website administrators and developers in troubleshooting any issues, as well as monitoring the health of the application.
By default, Sitefinity Cloud exposes the following logs:
- Build & Deployment logs
They indicate the state of the application build and deployment processes.
You can view these logs by clicking on a CI/CD pipeline in your Sitefinity Cloud Management Portal » Pipelines section.-
For ASP.NET Core Renderer :
DotNetCoreRenderer.CI.CD -
For Next.js Renderer :
NextJsRenderer.CI.CD -
For Sitefinity CMS :
CI.CDNOTE: This pipeline is available if the Developer Extensions toggle is enabled.
-
For Sitefinity backend UI extensions :
Extensions.CI.CD
For more information, see Decoupled extensibility for your backend UI.
-
- Sitefinity CMS logs
These include all Sitefinity CMS logs, such as the ones that are contained in theError.log,Trace.log, andAuditTrail.logfiles when hosting Sitefinity on-prem.
You can access them from the Management Portal of your Sitefinity Cloud project. - Decoupled Renderer logs
These include the ASP.NET Core Renderer application logs or the Next.js Renderer application logs. You can access them from the Management Portal of your Sitefinity Cloud project.
View the logs
To open your Sitefinity Cloud project logs and drill down in the application health data, perform the following:
- Open the Management Portal Welcome page.
- In the Environments section, click the View Logs link for the desired environment.
The Logs page opens. In the left navigation, the page displays a collection of predefined logs for your application, such as:- traces
This log aggregates the information from all system logs, except for the IIS Event Log and all Sitefinity CMS traces. In this log, you can find tracing information about the application performance and any handled exceptions. - exceptions
This log aggregates the IIS Event Log and Sitefinity CMS logs. In this log, you can find IIS error, warning, and information events data, as well as any unhandled exceptions.
- traces
- To view the entries inside any log, hover over the log and click Preview data.
- In the Query explorer, you can see different log entries by clicking a query entry and running it.
There are predefined query sets - Sitefinity logs filtered by log type. Using these queries, you can access Sitefinity CMS logs by log type -ErrorLog,Trace,Authentication, and more.
Query the logs information
By default, when you are viewing a log, you are presented with the latest 50 entries in it. Since the Sitefinity Cloud logs are based on Azure Monitor Log Analytics, you can build complex queries with the information contained in each log. This way developers and website administrators can easily find the information relevant to them, as well as implement custom logic for observing the entries they are interested in. For more information about the query syntax and advanced capabilities, see Microsoft documentation » Tutorial: Use Log Analytics.
Diagnose performance
By default, your Sitefinity Cloud project has a performance profiler enabled in auto mode. This means that the profiler automatically collects data in the background on certain intervals without imposing an extra overhead on your application performance.
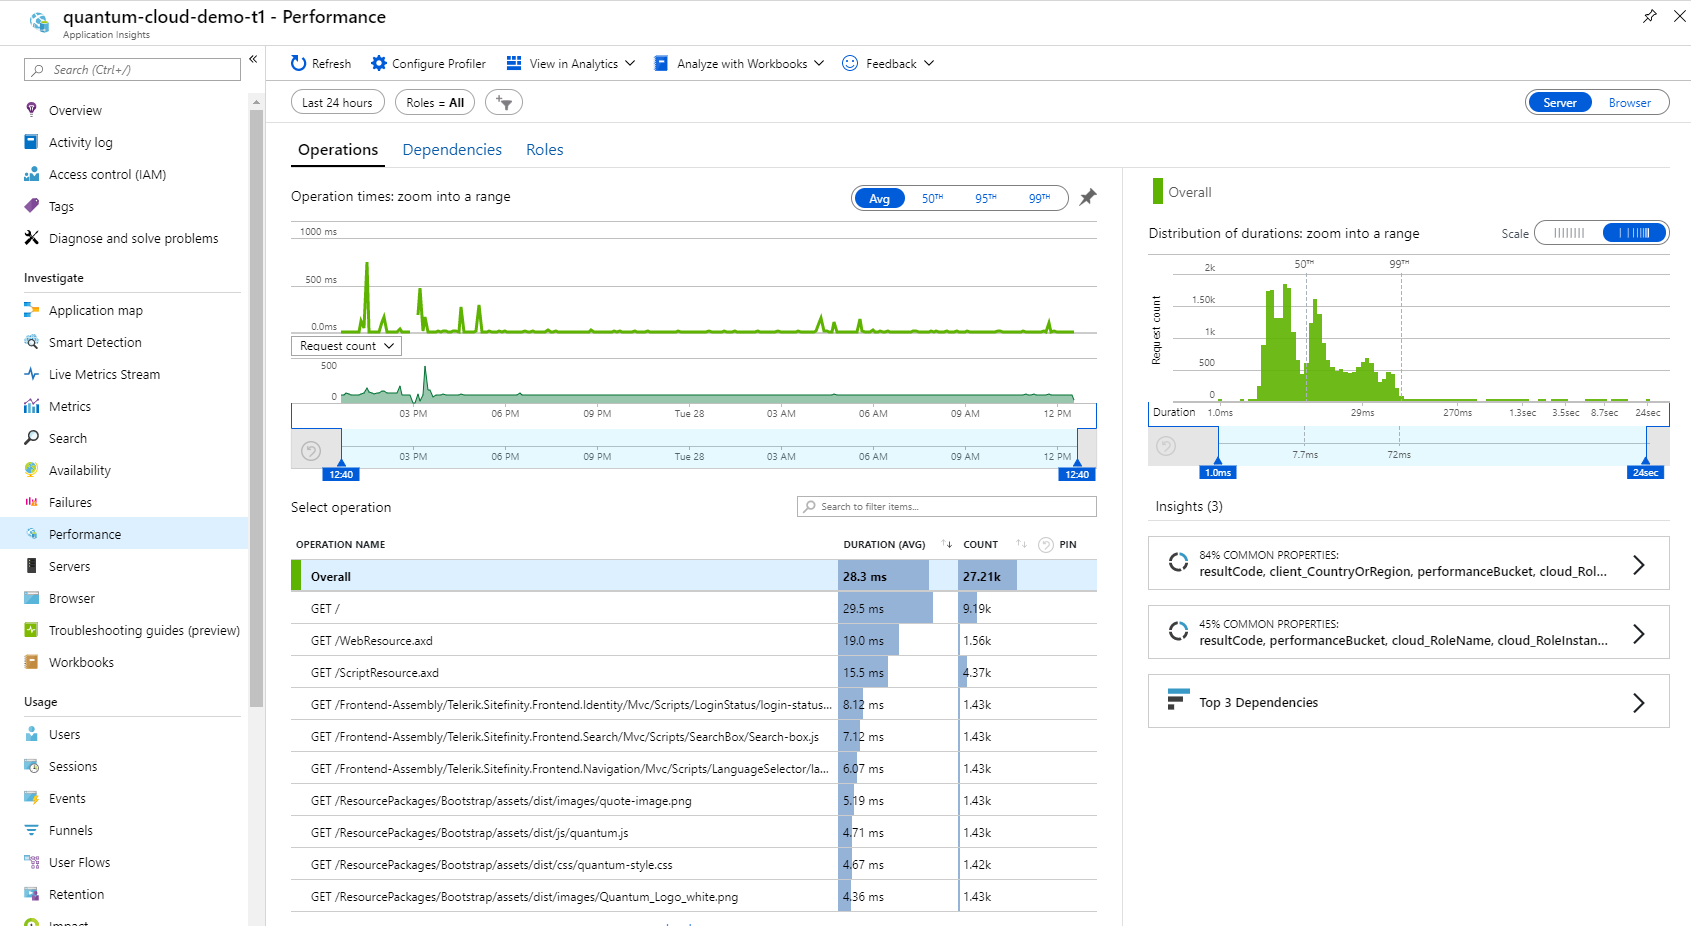
You can view, drill down, and analyze the collected profiler data by navigating to the Performance tab of your project's Application Insights in the Azure Portal:
The performance profiler is based on the Azure Application Insights profiler and automatically collects data about your application components, such as server-side operations, client-side operations, page views, and so on.
Profile performance on demand
By default. the performance profiler collects data on certain intervals as determined by the Azure default logic. If you want to profile your application on-demand, you can manually enable the performance profiler and monitor the results while browsing the parts of your application, which performance you want to measure. To enable the performance profiler, follow these steps:
- In your Sitefinity Cloud Management Portal, click the View logs link for the desired environment.
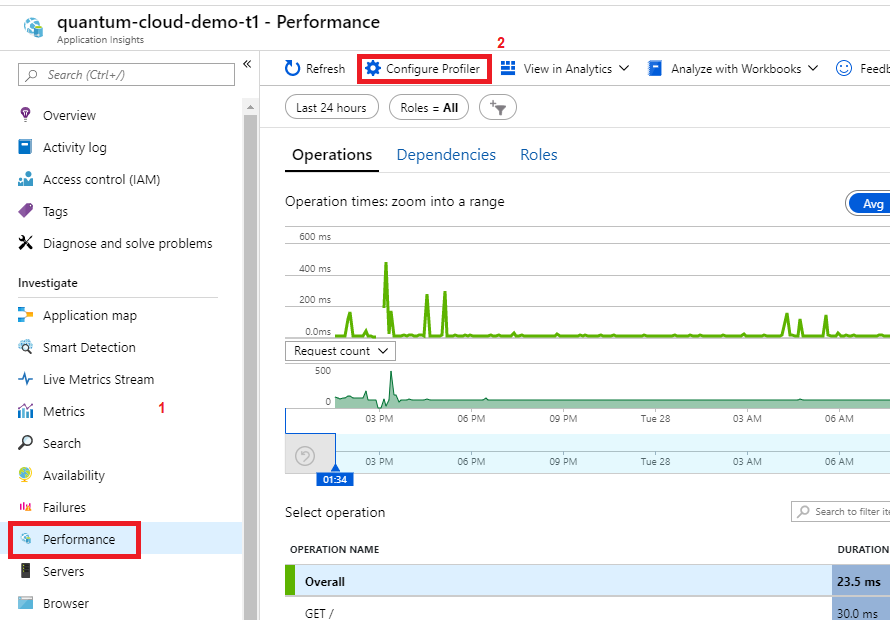
This redirects you to the respective Application Insights section in the Azure Portal. - Once the Application Insights page for your project opens, click on Performance in the left-hand navigation.
- From the top navigation, click Configure Profiler.

- On the next screen, click Profile now.
As a result, the profiler is enabled and you can monitor the ongoing sessions as you browse your Sitefinity Cloud project. The profiler will run for a few minutes until it collects sufficient data.
Review the deployment package
Sitefinity Cloud is configured in continuous integration and delivery (CI/CD) setup, in accordance with best practices.
On each commit to the main/master branch, the CI/CD pipeline produces a deployment package that is automatically deployed on the Staging environment.
In some cases, developers might need to inspect the deployment package for troubleshooting purposes.
You can check the content of the deployment package in the following way:
-
In Sitefinity Cloud Management Portal, navigate to Pipelines » Pipelines.
-
For ASP.NET Core Renderer: click the
DotNetCoreRenderer.CI.CDpipeline.
For Next.js Renderer: click theDotNetCoreRenderer.CI.CDpipeline.
For Sitefinity CMS: click theCI.CDpipeline.NOTE: The
CI.CDpipeline is available if the Developer Extensions toggle is enabled. -
Click the desired deployed release.
The deployment stages appear. -
Under the CI stage, click on the <Number> artifacts link.
The list of artifacts for the CI stage opens. -
Expand the
dropfolder. -
Download the
DeploymentPackage.zip.
This is the package deployed on all the environments by the deployment process. Only the configurations differentiate between the environments.
For more information, see Manage the configurations. -
Extract the files from the
.zipfile and ensure that all required files are included in the deployment package.
NOTE: Besides checking the files in the package, sometimes it is useful to set up this deployment package locally and troubleshoot any functionality that is not working after deployment.
Additional troubleshooting resources
Sitefinity Cloud is integrated with Azure Application Insights, thus delivering all available troubleshooting tools and mechanisms. For more information, see Microsoft documentation » Application Insights overview.
For example, you can use the Live Metrics Stream to monitor real-time data about your website's incoming and outgoing requests, as well as CPU utilization, memory consumption, and exception rate.
For more information about using Live Metrics Stream, see Microsoft documentation » Live metrics: Monitor and diagnose with 1-second latency.
